Today I would like to discuss the possibility of a market correction in Bitcoin and the
possibility of the fabled 50% bull market market correction, which seems particularly
unlikely at present.
With the U.S. dollar crashing against gold and Bitcoin it certainly seems unlikely that
the other safe-haven options are available in terms of currency options, hence gold and
BTC are likely to retain strength.

Source: Tradingview.com
Still, stranger things have happened, plus Bitcoin has historically seen a
significant pullback during bull markets at some point during most years while still
delivering positive returns over the full year.
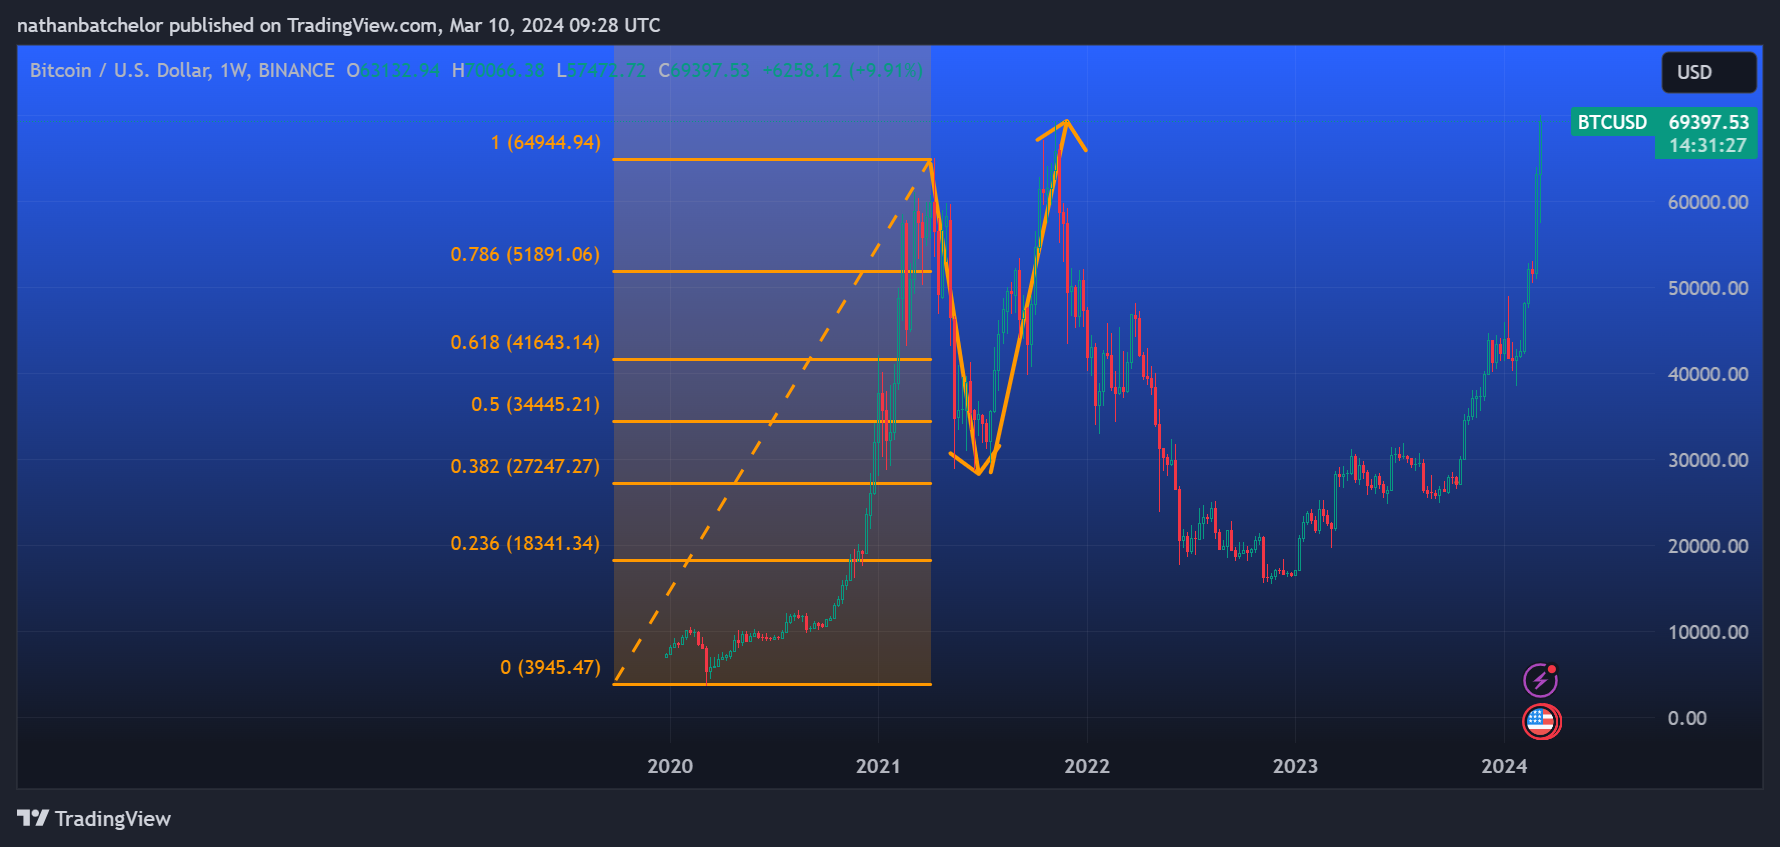
For example, in 2021 Bitcoin made a significant correction from just below $65,000
of around 50% before quickly rebounding and making a new high.
Source: Tradingview.com
Just a quick note, a bull market is when the price of the market is trending higher
over a long-term period.
A bear market is when the previous positive-trend breaks, and prices trend
lower.
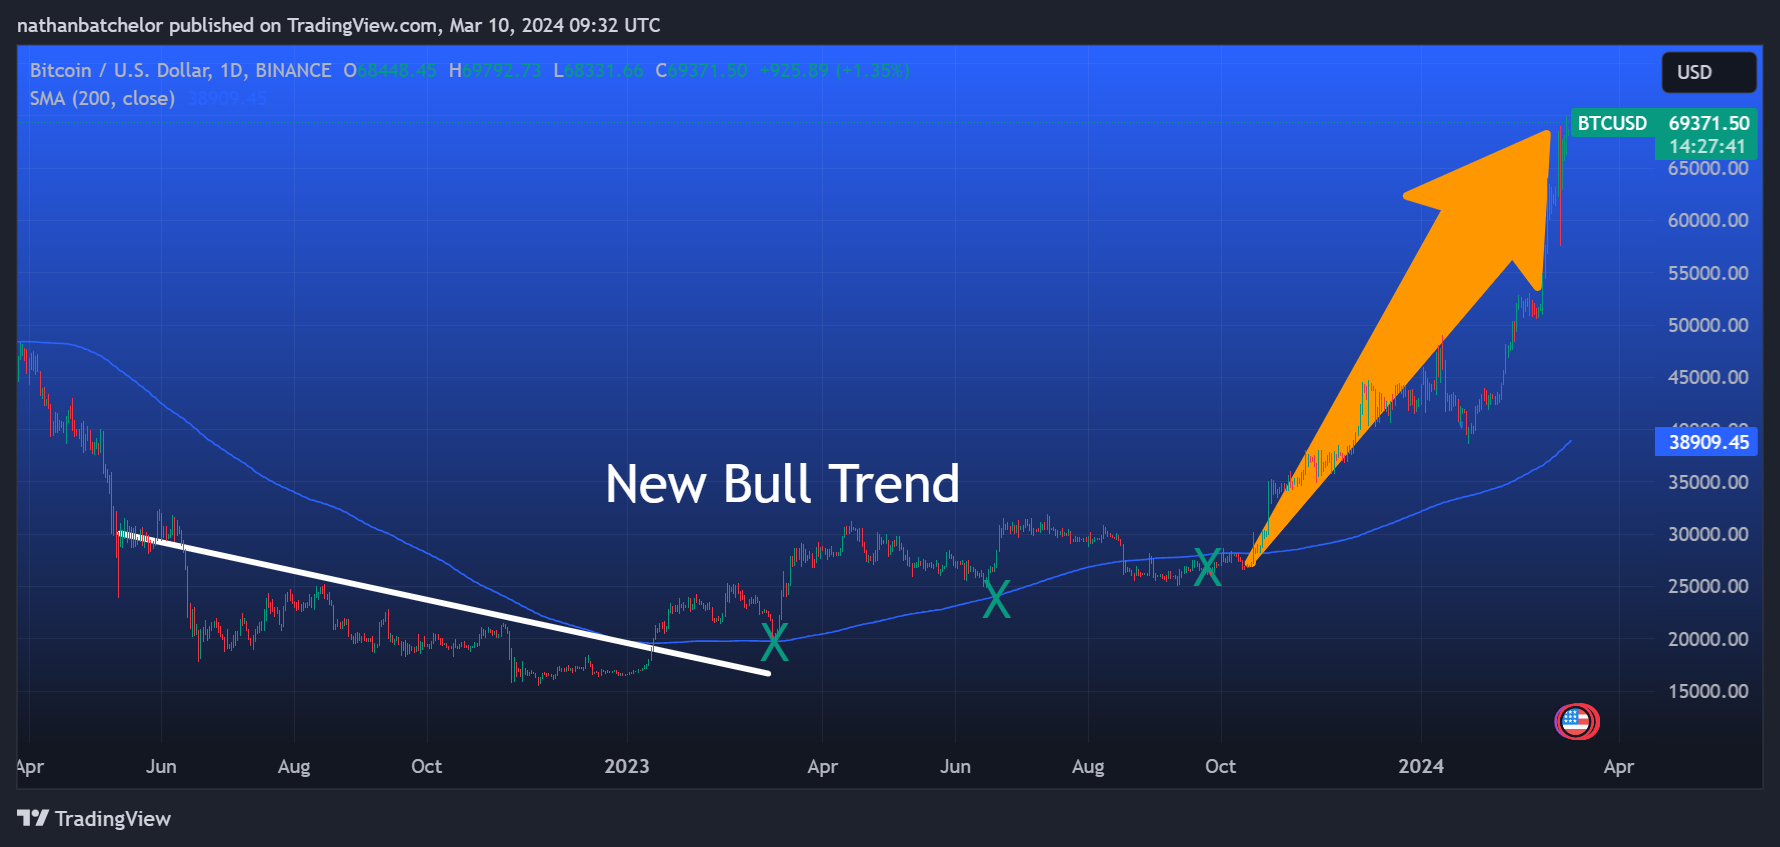
A correction in a bull market is typically short-lived, and should not break the major
moving averages for very long.
Source: Tradingview.com
In keeping with the theme of the article, let's explore the 50% correction from a
myriad of scenarios, plus locate the major and important moving averages.
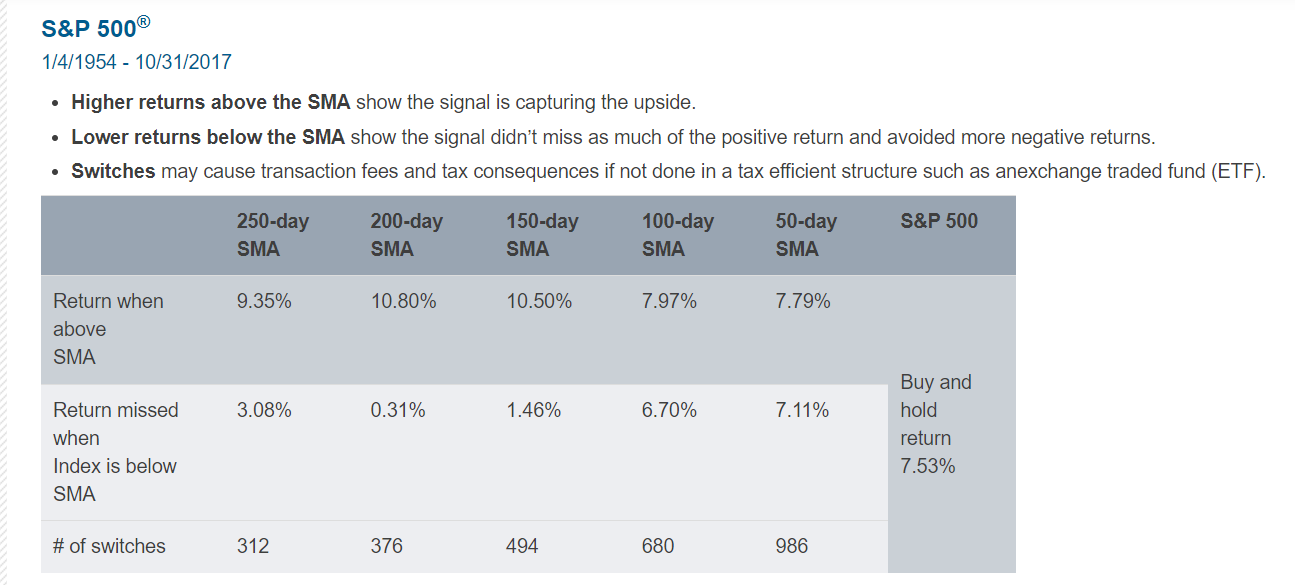
Starting with the key moving averages (which typically get tested during a bull market),
the 200-day moving average is a major favorite.
Source: PACERETFS.COM
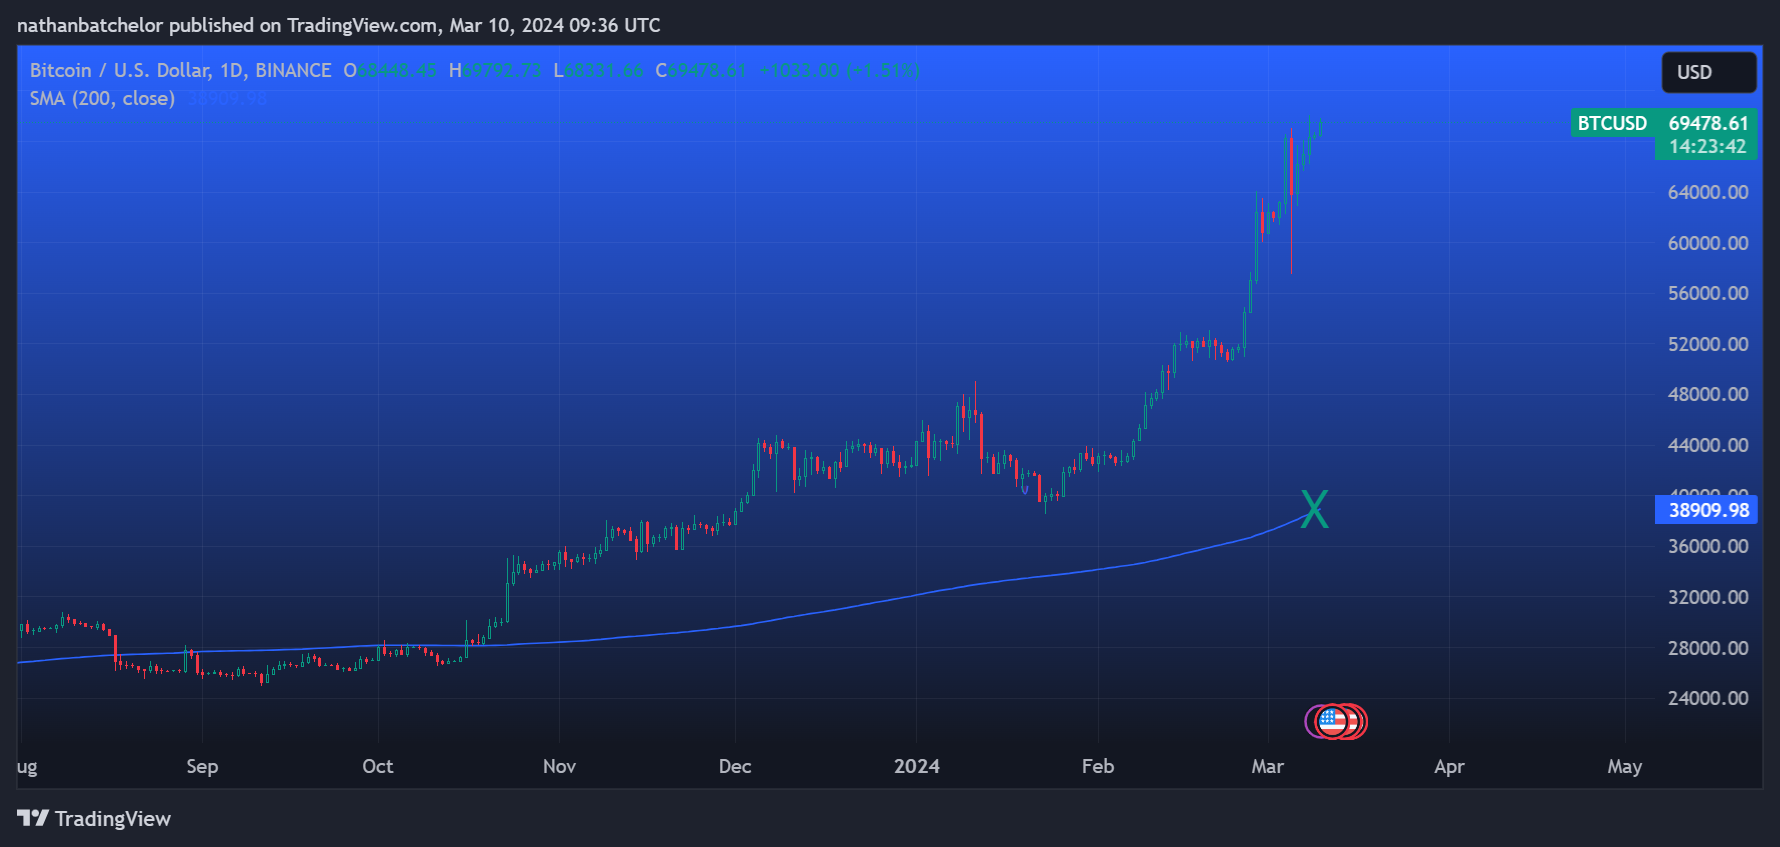
The current 200-day moving average sits around the $38,900 level, which is close to the
last major price low, and sits about 45% away from the current all-time high.
Interestingly, the 200-day moving average was breached for around 3 months before
Bitcoin came roaring back to a new high in May 2021 to November 2021.
Source: Tradingview.com
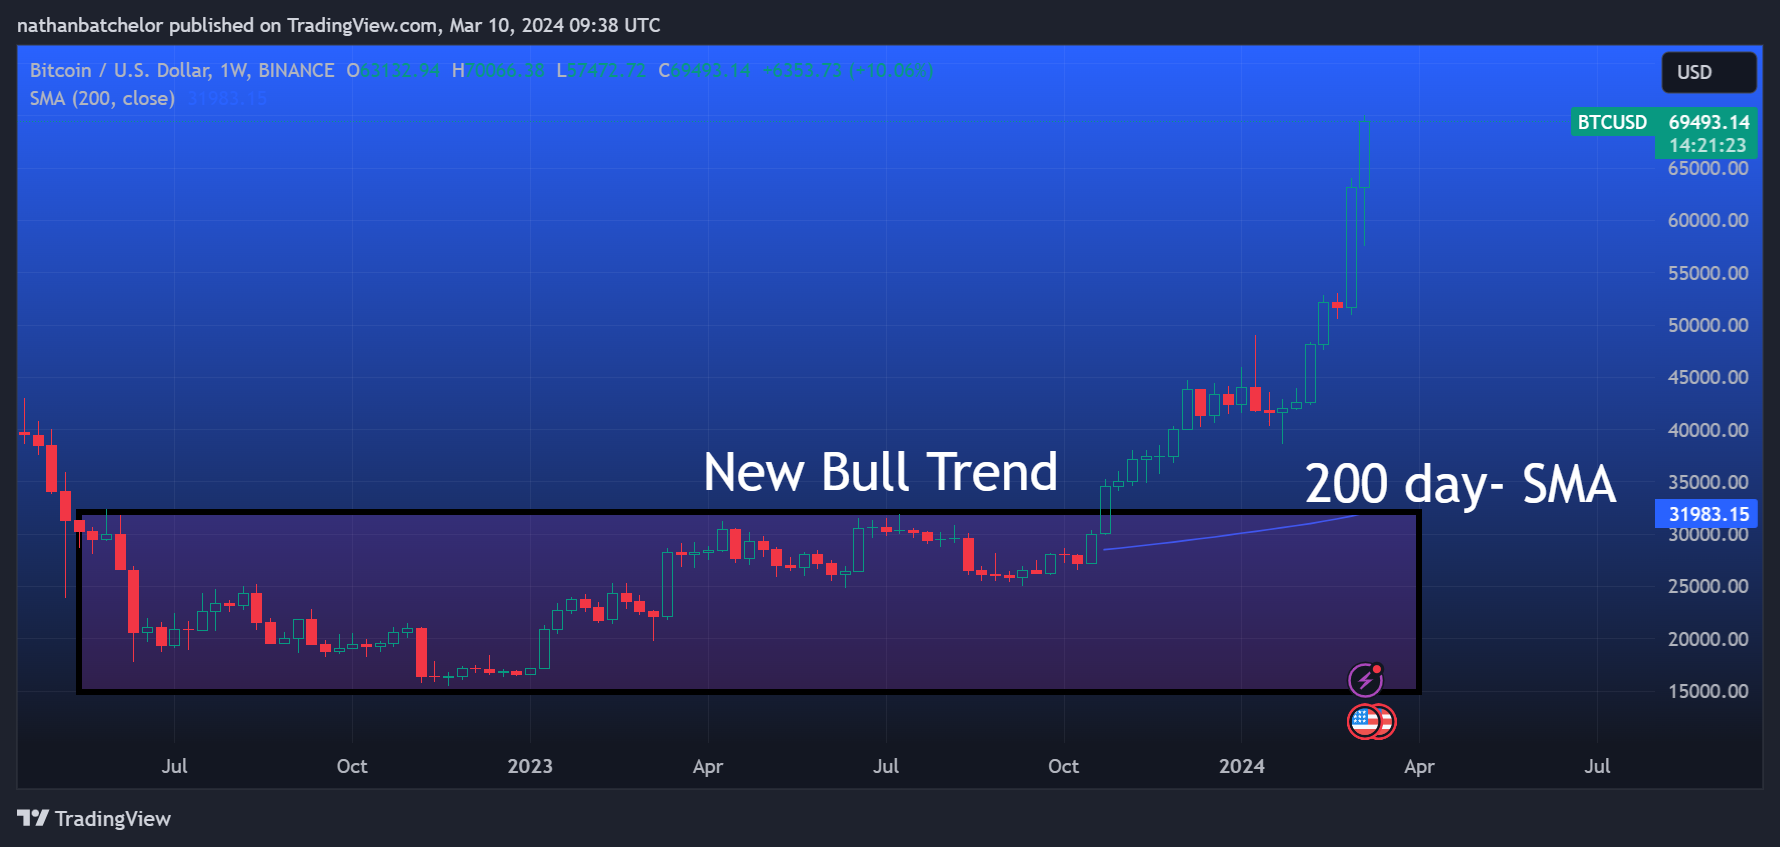
The main moving average that truly defines the bull market in my opinion is the 200-week
moving average. This key moving average sits around $31,978.
This happens to be the 2023 breakout level, and this area is also my preferred buy
spot if a major market correction happens.
Source: Tradingview.com
In between these levels sits the 2024 year pivot point, at $34,592, which is still
strangely untested in 2024.
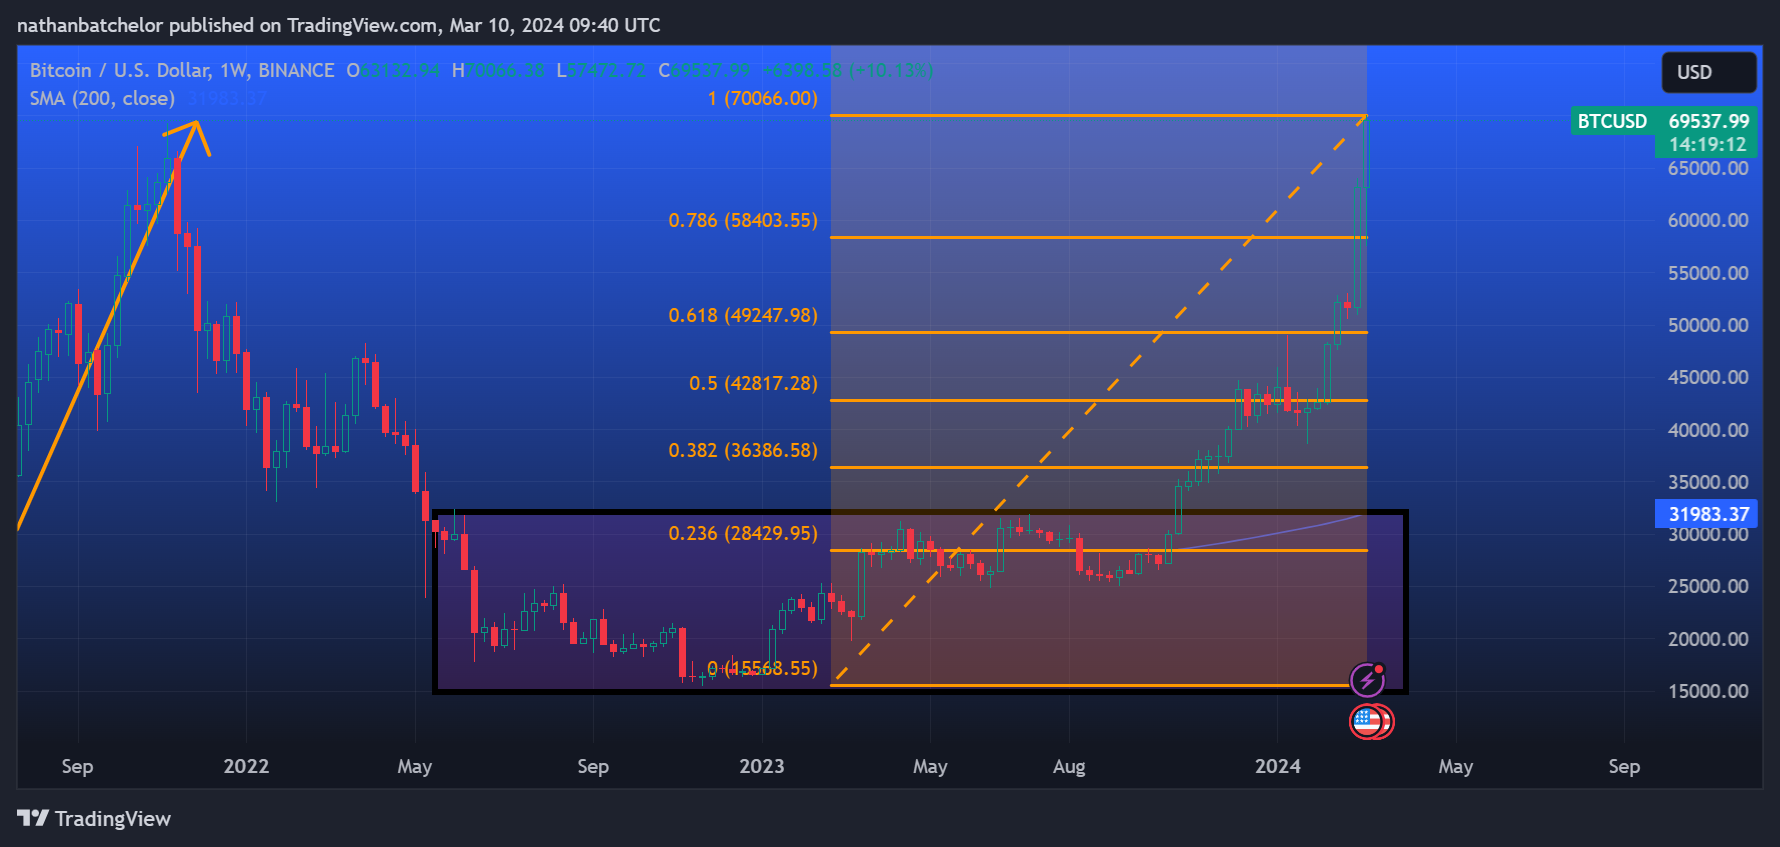
Looking at the Fibonacci scenario, if we consider Bitcoin has peaked, and we attached
the ATH to the 2022 low then the 50% correction comes in at around $42,800.
Source: Tradingview.com
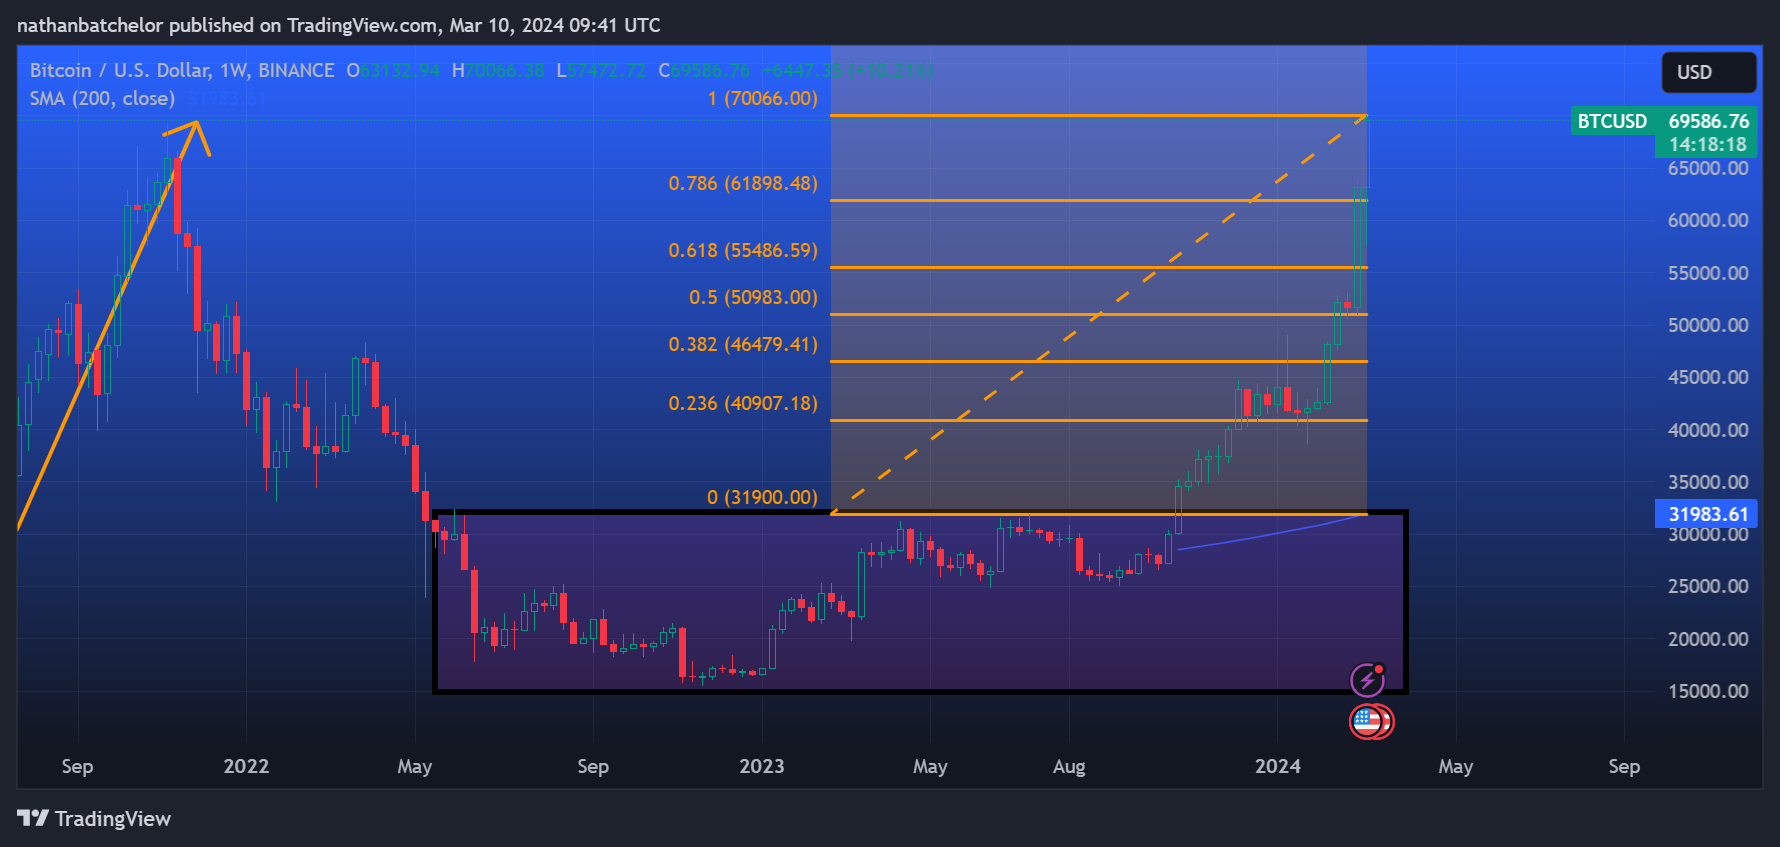
Consider also the Fibonacci retracement of the ATH to the 2023 breakout area, which
comes in around the $51,000 level, which happens to be a key correction level many are
positioned to buy back into.
Source: Tradingview.com
It remains to be seen whether the recent market volatility has reached its crescendo or
whether the up move will continue as massive ETF demand continues to drive the
price high.
Either way, it's important to remember that market pullbacks are not uncommon and
occur in Bitcoin bull cycles.
The interesting question is whether we get a full market correction to the 200-week
moving average or just a weaker one down to $51,000.
